Among the effects of the rapid evolution of information technology is the exponential growth in the volume of data related to our daily lives. This presents companies with unprecedented opportunities to more deeply understand their customers, anticipate their needs, and make informed decisions about product innovations and competitive strategy.
Many of the world’s leading brands are making significant investments in data analytics. To reap the maximum return, it’s essential to understand the role of data visualization in helping to identify and articulate data in ways that inspire game-changing insights and better decisions.
As a business intelligence analyst, I am frequently asked “What does a good data visualization look like?” There is not one simple, correct answer, but here are several fundamental features that characterize visualizations that are appealing, accessible and effective.
1. A good visualization reveals problems and inspires solutions.
For exploratory data visualizations, the critical factor is not what is on the diagram, but rather how people respond to it. Here is a classic example. 
Diagram source: https://en.wikipedia.org/wiki/1854_Broad_Street_cholera_outbreak This map visualization was created by Dr. John Snow in the mid-19th century London during a devastating cholera outbreak. He mapped the 13 public wells and all known cholera deaths around the city and noted a spatial clustering of cases around the same public drinking well. This pattern provided evidence that the contaminated water was the cause of cholera. With this insight, the London government built a sewage system to control and stop the cholera spread. In an age of scant business-intelligence tools, Dr. Snow’s visualization effectively revealed a root causal problem and inspired the right solution.
2. Explanatory visualizations should be straightforward and easy to understand.
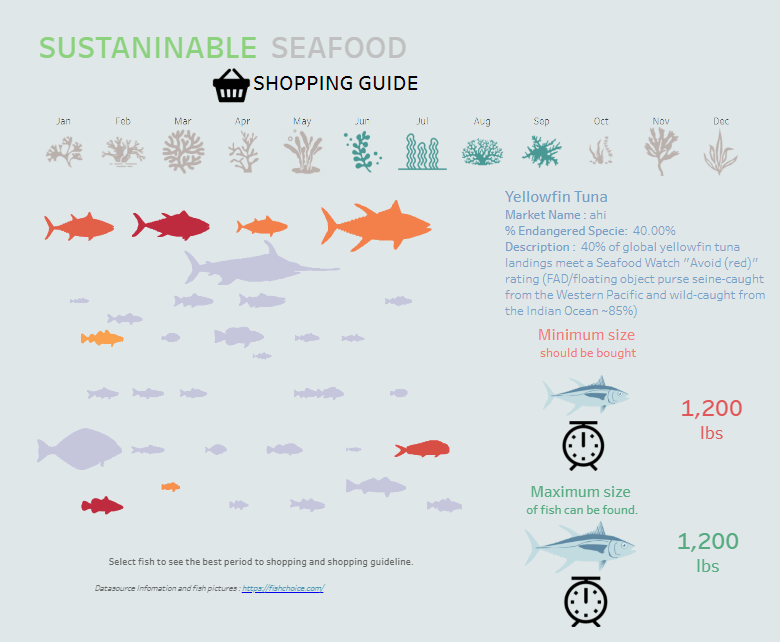
Here are two creative examples that I admire:  Diagram source: https://public.tableau.com/profile/siroros.roongdonsai#!/vizhome/SustainableSeafoodShoppingGuide/Dashboard1 This is a snapshot of an interactive dashboard created by Siroros Roongdonsai. Clicking on the fish type gives you the sustainable shopping guide on the right side. This particular visualization provides a simple and efficient way to integrate a vast amount of information in a single-page dashboard. The creator ensured that the intended audience would be able to easily understand the visualization.
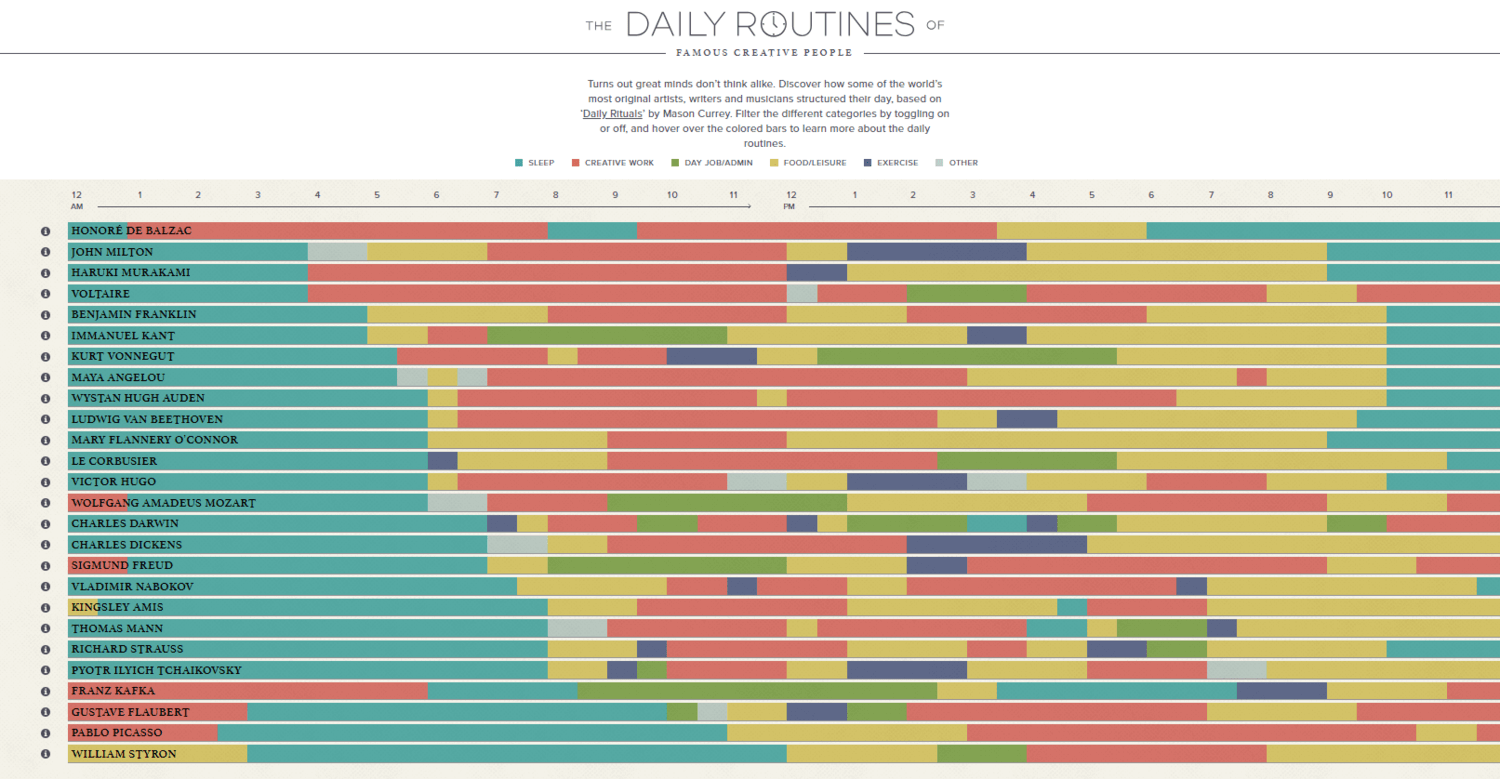
  Diagram source: https://podio.com/site/creative-routines
This visualization describes the daily routines of some famous celebrities by dividing their routines into six categories, marked by six different colors. It’s very clear for readers to find the pattern of when the celebrities eat, sleep, or work. This visualization method can also be very helpful for conducting customer-level analysis within a defined period.
Today’s business intelligence software provides analysts with powerful options for creating robust visualizations. But the most important component of an effective visualization is the analyst’s desire to facilitate understanding and insight by conveying the data with clarity and relevance.


