


Outlier detection is crucial for data analysis in general, but especially in bioinformatics and data science to maintain data integrity and avoid misleading conclusions. Outlier identification can ensure accurate analysis and meaningful insights by detecting possible problems or highlighting important features in the data. Outliers can exist either from experimental errors, data corruption, or genuine biological/business variations. In the former two instances, outlier removal will provide more accurate insights and avoid misleading conclusions. In the case of biological/business outliers, the identification is still crucial as it will not only drive the conclusions but will affect the selection of tests and the potential for predictability (e.g., in a trained model).
Don’t remove everything
We do not want to remove all the outliers at once since real biological/business variation might be represented. For example, one might be analyzing microscopy imaging with fluorescence where the outliers might represent the actual genes of interest. Alternatively, you can think of the stock market, where outliers might represent emerging trends in specific businesses. This then poses the question; how can we accurately, efficiently, and interpretably identify outliers in our data? There are multiple ways, from distributional (e.g., Z-score), cluster-based (e.g., LOF), geometric models (e.g., Angle-based techniques; ABOD), machine learning (e.g., Isolation forests, auto encoders), among others, where every single option has pros and cons.
Need help identifying the right outlier detection method for your project?
Book a Consultation to Discuss Your Dataset and Goals.
What we’ll cover
In this blog post, we will explore the application of the interquartile range (IQR) method since it’s not very sensitive to the distribution of the data (like z-score) and the interpretation is “clean” and clear (it can get murkier in some ML algorithms for example). Here we will explain the IQR method, how to apply it, understand its significance in bioinformatics and data science, compare it with other outlier detection methods, and discuss its benefits in these contexts.
The Interquartile Range (IQR)
Before diving into outlier detection, let’s understand the concept of the interquartile range (IQR) in the context of bioinformatics and data science. The IQR is a statistical measure that characterizes the spread and variability of a dataset. Interestingly, despite it gives you information on the distribution of the data, is one of the methods that is not too affected by the non-normality or non-parametricity of the data. It is calculated as the difference between the upper quartile (Q3) and the lower quartile (Q1) values. In essence, is creating a box-plot with the data, where the box composed of data that falls between quartiles 1 and 3, the wires are the min and max.  Often, we can see outliers in such plot (as points outside of the expected min/max; see above). But what are quartiles? According to Wikipedia:
In statistics, a quartile is a type of quantile which divides the number of data points into four parts, or quarters, of more-or-less equal size.
IQR, as its name gives away, computes the range between Q1 and Q3, essentially giving you an idea of the distribution of the data and as you’ll see below, it allows you to determine lower and higher thresholds for the acceptable values given your data.
What Datasets can you expect
In bioinformatics and data science, datasets often contain measurements such as gene expression levels, DNA sequences, clinical data, stock values, customer satisfaction, etc. This kind of data often comes with data points outside of the expected values, either because true variation (e.g. high gene expression or stock shorting, etc.), or because of errors in collection, measurement or manipulation of the data. Picture image processing in spatial omics, where the intensity in the image is tied to a particular marker of interest. The background of the image, although we would expect to have no intensity, can have some fluoresce based on the dye or microscope illumination (often both). You can also have extremely bright spots that are artifacts, or the edge of the well. We also will have very bright spots where the signal is very strong. With the IQR you have some certainty that what it contains is somewhat true signal, the low outliers (and often the low quantiles) will be comprised mainly by background (unless your image is mostly background, in which case the median will be shifted), and the high outliers along with the upper quartile range (Q3 to Q4) will contain some of the true signal and some of the artifacts.
A Dataset Comparison
We can also consider a business example where we have the sales revenue of different stores in a retail chain. The client has task us to identifying any stores with unusually high or low sales performance, in other words, we want to detect outlier stores. Using the IQR method we can not only identify the low and high performers, but we can judge the spread of the sales data, and we can then correlate this information with location, demographics and population trends, competitors, etc. The IQR allows us to focus on the central tendency of the data, capturing the middle 50% of observations and providing a robust estimate of the spread, and allowing you to estimate the thresholds where the data is not expected to be. It also allows you to see (if plotted) the skewness of the data by showing the position of the median relative to the other quartiles.
Outlier Detection using the Interquartile Range Method
The IQR method offers a simple yet effective approach for outlier detection, identifying data points that deviate significantly from the majority. The steps involved in outlier detection using the IQR method are as follows:
- Calculate the first quartile (Q1) and third quartile (Q3) of the dataset.
- Compute the interquartile range (IQR) as the difference between Q3 and Q1 (IQR = Q3 – Q1).
- Define the lower outlier threshold as Q1 – (1.5 * IQR) and the upper outlier threshold as Q3 + (1.5 * IQR).
- Identify any data points that fall below the lower threshold or above the upper threshold. These observations are considered outliers.
- Analyze and interpret the outliers within the specific context of bioinformatics or data science. Outliers may warrant further investigation to understand their underlying causes or may need to be appropriately handled or removed during data preprocessing.
Usage of 1.5 as a Multiplier in the Interquartile Range (IQR) Method and the Normal Distribution
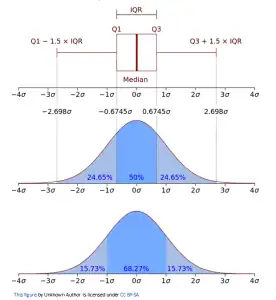
The interquartile range (IQR) method for outlier detection is often applied to datasets assumed to follow a normal distribution (although not required for this method). In this context, the choice of a multiplier becomes particularly relevant. Let’s explore why a multiplier of 1.5 is commonly used and visualize its implications in relation to the normal distribution.
- The Empirical Rule: In the normal distribution, approximately 68% of the data falls within one standard deviation from the mean, 95% falls within two standard deviations, and 99.7% falls within three standard deviations. This pattern, known as the empirical rule or the 68-95-99.7 rule, provides a basis for understanding the expected range of data points in a normal distribution.
- The IQR Method and Outlier Thresholds: The IQR method defines outlier thresholds based on the interquartile range, which captures the middle 50% of the data. By multiplying the IQR by a chosen factor, outliers can be identified as data points that fall beyond a certain range from the upper and lower quartiles. A common choice for this multiplier is 1.5. Let’s visualize the outlier thresholds using a normal distribution as an example:

- Identifying Outliers: Based on the outlier thresholds defined by the IQR method, data points that fall below the lower threshold or above the upper threshold are considered outliers. These points deviate significantly from the central region of the distribution and may represent unusual or anomalous observations.
- Sensitivity and Stringency: The choice of a multiplier in the IQR method determines the stringency of the outlier detection. A smaller multiplier would result in tighter outlier thresholds, capturing only extreme outliers. Conversely, a larger multiplier would yield wider outlier thresholds, encompassing a broader range of observations as outliers. By using a multiplier of 1.5, the IQR method strikes a balance between sensitivity and stringency. It identifies outliers that deviate approximately 1.5 times the IQR away from the upper or lower quartiles, capturing significant deviations from the expected range without being overly stringent or overly permissive.
- Convenience: If you see in the image above, 1.5 as a multiplier does not quite represent 3 standard deviations. In a normally distributed data this value should be 1.7. However, 1.5 seems to be a more rounded value.
Comparison with Other Outlier Detection Methods
While the IQR method is a popular and effective approach for outlier detection, it’s important to consider other methods available. Let’s compare the IQR method with two commonly used techniques, and a group of methods: Z-score, Tukey’s fences, and machine learning (ML) methods.
- Z-score Method: The Z-score method standardizes the data by calculating the number of standard deviations a data point deviates from the mean. Any data point with a Z-score beyond a certain threshold, often set as 2 or 3, is considered an outlier. In comparison with the IQR method.
- The Z-score method is more sensitive to outliers compared to the IQR method. It detects outliers based on their deviation from the mean rather than their relative position within the data distribution.
- In bioinformatics and data science, the Z-score method can be useful when data closely follow a normal distribution. However, biological data often deviates from normality, and the IQR method offers more robustness in such cases.
- Tukey’s Fences: Tukey’s fences, like the IQR method, utilize the interquartile range for outlier detection. However, instead of using a fixed multiplier like 1.5, Tukey’s fences employ a multiplier, often denoted as k, which can be adjusted based on the desired level of stringency. In comparison with the IQR method:
- Tukey’s fences offer flexibility in choosing the multiplier, allowing for more stringent or lenient outlier detection by adjusting the value of k. The IQR method, with a fixed multiplier like 1.5, provides a standardized approach.
- Both methods are effective in detecting outliers, but Tukey’s fences allow for a more customizable threshold based on the specific dataset and analysis requirements.
- Machine Learning Outlier Detection Methods: These methods utilize various algorithms and techniques to identify outliers based on patterns and anomalies in the data. They often handle complex and high-dimensional datasets and can be more robust than simple statistical approaches. Machine learning outlier detection algorithms include supervised methods (e.g. One-Class SVM, Random Forest Outlier Detection), unsupervised methods (e.g. DBSCAN, Isolation Forest, Local Outlier Factor (LOF)) and semi supervised (e.g. Self-Training, and Label Propagation) methods. ML methods have:
- Higher complexity: IQR outlier detection is a straightforward method that only requires basic statistical calculations. Machine learning outlier detection methods are more complex and may involve algorithm training, parameter tuning, and feature engineering.
- Multivariate capability: IQR outlier detection primarily focuses on univariate analysis and may not be suitable for detecting outliers in high-dimensional datasets. Machine learning methods can handle both univariate and multivariate data effectively.
- Adaptability: ML outlier detection methods can adapt to different types of data and outlier patterns. They can be trained on one dataset and applied to another. IQR outlier detection is specific to the dataset it is applied to and may not generalize well.
- Higher requirements: For most ML algorithms a significant amount of data is required.
Benefits in Bioinformatics and Data Science
The IQR method, specifically in the context of bioinformatics and data science, offers several benefits:
- Increased data quality
- Robustness to noise and variability: Biological datasets often exhibit inherent noise and variations due to complex biological processes or experimental conditions. The IQR method is resistant to outliers and extreme values, making it suitable for handling noisy data and minimizing the impact of outliers on downstream analyses.
- Interpretability: The IQR method provides a transparent and intuitive approach to outlier detection. By considering the relative position of data points within the distribution, it allows researchers to identify outliers based on their deviation from most of the data. Other approaches, such ML-based, are based on difficult to understand models.
- Flexibility and adjustability: While the IQR method traditionally uses a multiplier of 1.5 to define outlier thresholds, it can be adjusted based on the specific requirements and characteristics of the dataset. This flexibility allows researchers to fine-tune the outlier detection process and adapt it to different scenarios.
- Compatibility with various data types: Bioinformatics and data science encompass a wide range of data types, including genomics, proteomics, imaging data, and clinical data. The IQR method can be applied to diverse types of data, making it a versatile tool in these domains.
Conclusion
In the fields of bioinformatics and data science, outlier detection is critical for accurate analysis and reliable results as it ensures data quality, supports anomaly detection, facilitates data preprocessing, enhances modeling performance, provides valuable insights, and enables domain-specific applications. By effectively handling outliers, bioinformaticians and data scientists can make more accurate predictions, discover hidden knowledge, and derive actionable insights from their data. The interquartile range (IQR) method provides a powerful and straightforward approach to identify outliers in diverse datasets. By utilizing the IQR and defining appropriate outlier thresholds, researchers can effectively detect outliers and mitigate their impact on subsequent analyses. The robustness, interpretability, and flexibility of the IQR method make it a valuable tool in the context of bioinformatics and data science, enabling researchers to make informed decisions and derive meaningful insights from their data. If you’re looking to apply these techniques in your own work, our data consulting experts and data analytic services can help you design a tailored approach to outlier detection and reliable analysis. Additionally, by comparing the IQR method with other outlier detection techniques such as the Z-score method and Tukey’s fences, researchers can choose the most suitable approach based on the specific characteristics of their data and analysis requirements.
Further Reading: Shiny Python