

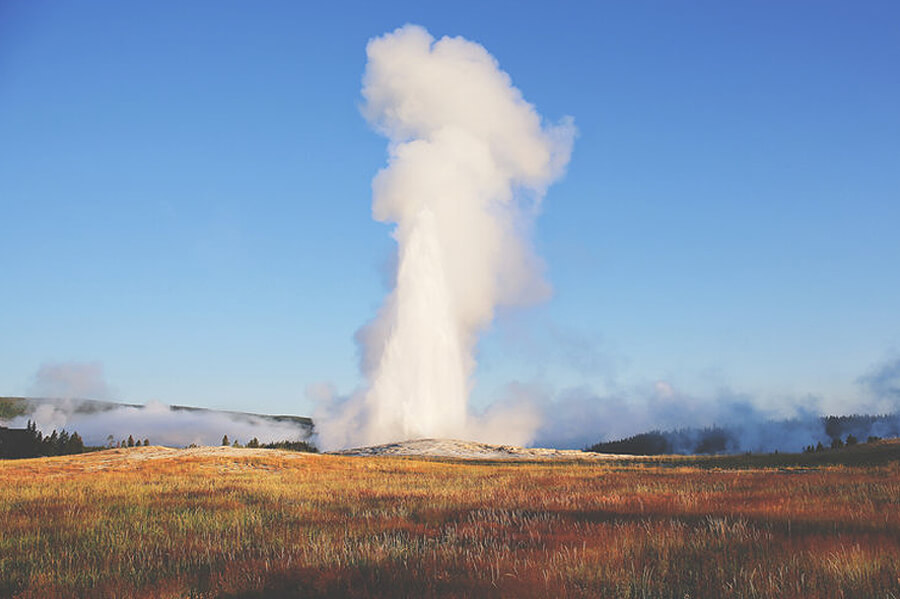
Recently, I visited Yellowstone National Park, which is well known for its geyser basins, lakes, scenic mountains, and variety of wildlife. As a data scientist, I was amazed by the park officials’ ability to predict the time and duration of geyser eruptions. My extreme curiosity drove me to explore how they did it. After reviewing a few articles, I learned about their prediction process and the data science behind it.
I specifically investigated the prediction of the most famous geyser, Old Faithful. While playing with the data, I found—to my surprise—that R Studio has a built-in data set for Old Faithful eruptions. Below is a sample of the data set.
 Old Faithful is currently bimodal. It has two eruption durations, one that lasts more than four minutes and a second that occurs more rarely and lasts about two-and-a-half minutes. The objective is to figure out if it is a long or short eruption—a clear classification problem.
After plotting the data, I saw a linear relationship between the waiting time and duration, which implies that as the waiting time increases, the duration of the eruption increases. For this reason, I chose to employ a simple machine learning algorithm, linear regression. Although it was a classification problem, we can apply regression and obtain more accurate results. To convert them into two classes, we enforce a condition on the regression results. The data set already exists in R, so I performed the predictions using R programming.
Visualization provides a unique perspective and better understanding of the data set. It is clear from the box plot below that the range is around 40-100. Interpreting and understanding the quartiles, median and the range is important here.
 Once the model is finalized, we would split the data into training and testing sets. The lm function in R applies the linear model to the data and gives us the estimates (i.e., the value of the intercept/constant).
y = mx + c
ExpectedDuration = m (waiting time) + c
Now, let’s assume the waiting time between eruptions is 75 minutes. We would use the above equation and have:
ExpectedDuration = 0.073901 (75) -1.792739 = 3.749836
Similarly, for any new waiting time, the duration would be predicted in the way shown above. Based on the results, we can conclude that as the waiting time increases, the geyser eruption will have a longer duration. Therefore, it would fall into the long duration class. On the other hand, if the waiting time decreases, the geyser eruption would fall into the short duration class.
In summary, we don’t necessarily need to apply a complex machine learning or deep learning algorithm to solve a data science problem. My interest to know how the geyser eruptions were predicted led me to play around with the data. Deriving these conclusions was organic and came out of sheer curiosity. By performing a simple linear regression model, we have achieved great results. So, applying a complicated machine learning algorithm does not always equate to great results. Sometimes, a machine learning algorithm is not necessary, and a simple algorithm, such as a linear regression, is actually more effective.