Employee attrition means a loss of valuable staff and talent. A high turnover rate is costly. An organization invested its time and money in recruiting and training employees, and the employees take all skills and qualifications they developed for their positions when they leave. The organization needs to spend a cost on the termination, hiring process, and the rest of employees need to cover the workload for the unoccupied position. There are various reasons for employees to leave an organization. We can analyze employee HR data and estimate their reason to leave as well as help organizations retain valuable employees.
IBM provides SAMPLE DATA: HR Employee Attrition and performance data on their community webpage. This is fictional sample data, but it can give us good ideas on how to analyze HR data and build classification models to predict attrition. This post will show you the step-by-step analytics process in R.
Exploratory Data Analysis
Let’s start with importing the dataset into R dataframe and exploring the data shape and the attrition distribution.
df <- read.csv(“../data/WA_Fn-UseC_-HR-Employee-Attrition.csv”)
head(df)
dim(df)
table(df$Attrition)

Data have 34 HR features and attrition information. About a fifth of employees left the company.
It is important to have a better understanding on dataset. Building a machine learning model in R is not difficult. It can be only a couple of lines of code. However, tuning the model to achieve goals requires preprocessing on the dataset. A good understanding on the data can help us choose a proper preprocessing method. Missing values need to be taken care of and biased data sometimes need to be balanced, and highly correlated features need to be removed.
The code below organizes information of the data in a place such as the presence of missing values in each column, mean, standard deviation, percentiles, and distributions. This allows us to minimize how much time we spend on exploring missing values and plotting histograms.
df %>% skim() %>% kable()
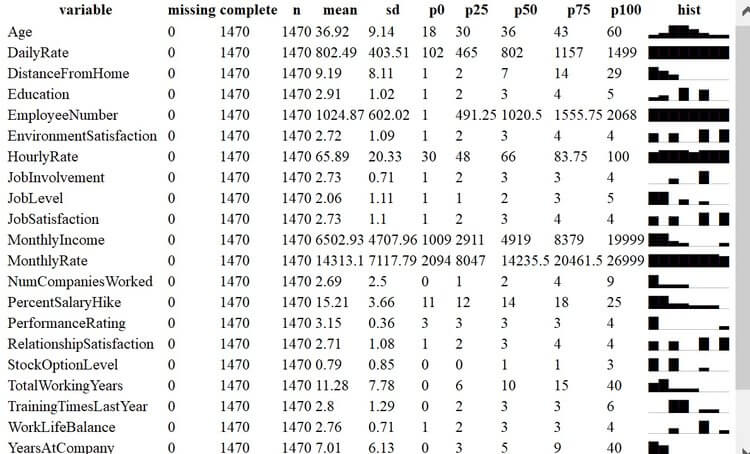
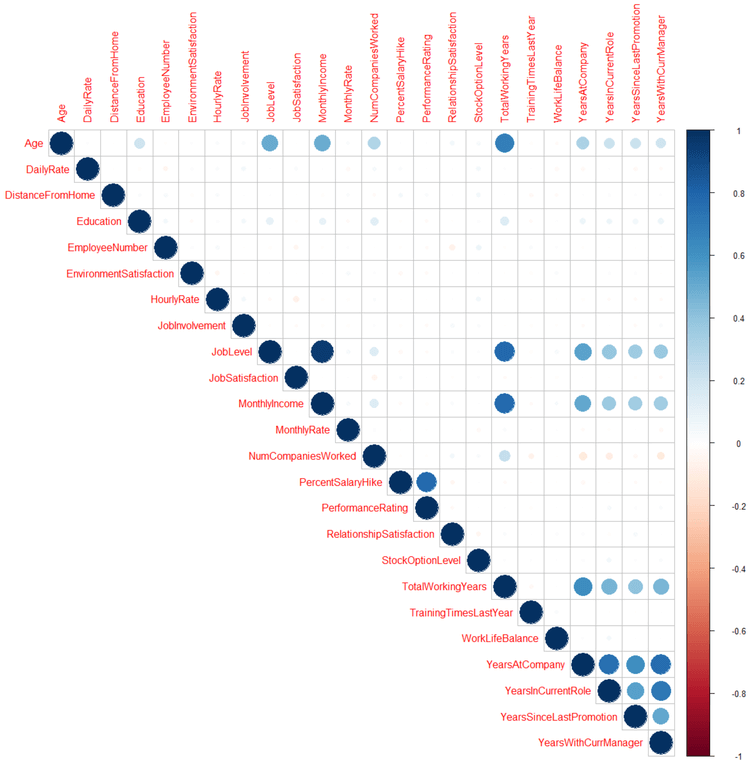
The code below will show the correlation plot for numerical features. Viewing the correlations helps us understand multicollinearity. The values range from -1 to 1 with positive values indicating a direct relationship and negative values indicating an inverse relationship. The closer to 1 or -1, the stronger the correlation between features. The correlation plotallows us to find correlated features quickly. For instance, we see that ‘Job level’ is highly correlated to ‘Monthly income’ and ‘Total working years’ and ‘Percent salary hike’ is correlated to ‘Performance rating’. You can go through the plot and decide what features to include and what features to minimize or eliminate.
num_fea <- which(sapply(df,is.numeric))
corrplot(cor(df[num_fea]),type = “upper”)
Machine Learning Modeling
Now we are ready to move on to model building. Randomly select 70% of the data to train the model and the rest will be for validation of the model. A random forest classification model will predict the attrition. Accuracy, confusion matrix, and AUC (area under the curve) scores are chosen as metrics to evaluate the model.
idx <- sample(nrow(df), nrow(df) * .70)
train <- df[idx,]
test <- df[-idx,]
rf <- randomForest(Attrition~., train, importance=TRUE, ntree=1000)
prd <- predict(rf, newdata = test)
confusionMatrix(test$Attrition, prd)
rocgbm <- roc(as.numeric(test$Attrition), as.numeric(prd))
rocgbm$auc
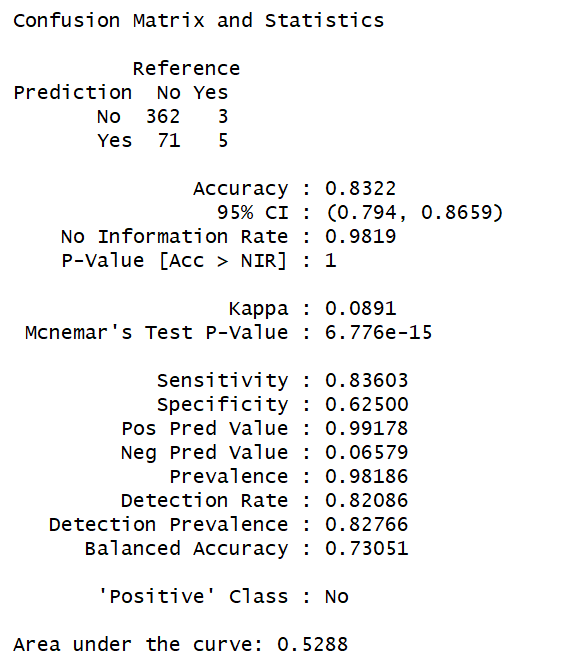
The accuracy of the model is 0.83 which is good, however, the confusion matrix indicates that there are many false positives which is reflected on low specificity compared to high sensitivity. The data is biased as we found that less than 20% of people left company. Even though the accuracy of the model is high, AUC score is as low as 0.52. We can balance the data to avoid bias. There are multiple ways to balance data. We will use SMOTE for majority down-sampling and minority over-sampling and then retrain the random forest model.
df_balanced = SMOTE(Attrition~., df, perc.over = 200, k = 5, perc.under = 100) table(df_balanced$Attrition)

idx <- sample(nrow(df_balanced), nrow(df_balanced) * .70)
train <- df_balanced[idx,]
test <- df_balanced[-idx,]
rf <- randomForest(Attrition~., train, importance=TRUE,ntree=1000)
prd <- predict(rf, newdata = test)
confusionMatrix(test$Attrition, prd)
rocgbm <- roc(as.numeric(test$Attrition), as.numeric(prd))
rocgbm$auc
Post Analysis
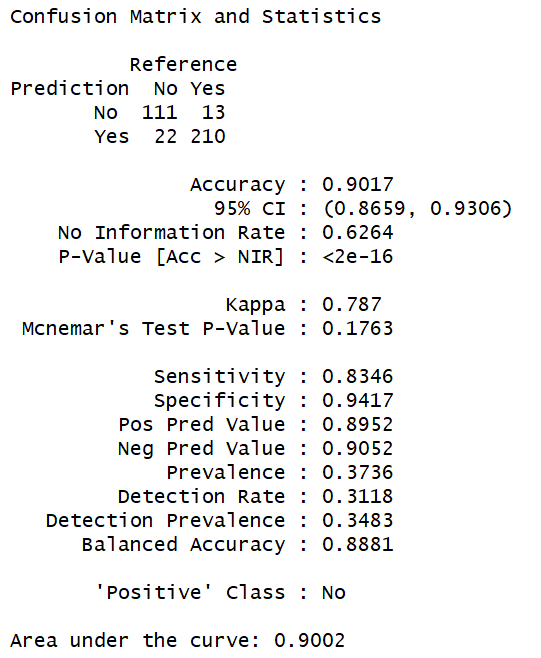
We can see that balancing the data has led to an improvement in our model. The confusion matrix shows that false negatives increased slightly, but false positives were significantly decreased. The accuracy of our model increased by 7%, and AUC score increased from 0.5288 to 0.9002. The model sensitivity is similar but specificity increased from 0.625 to 0.9417. Now that we are satisfied with our model we can investigate what features are important to predict attrition. Our Random forest model provides variable importance through the command below. Features toward thetop are more important and a rough measure of each features relative importance is provided.. The most important feature is “stock option level” and we can now analyze the distributions for remaining employees versus employees that left to understand how to award stock options to employees and retain them. varImpPlot(rf,type=2) 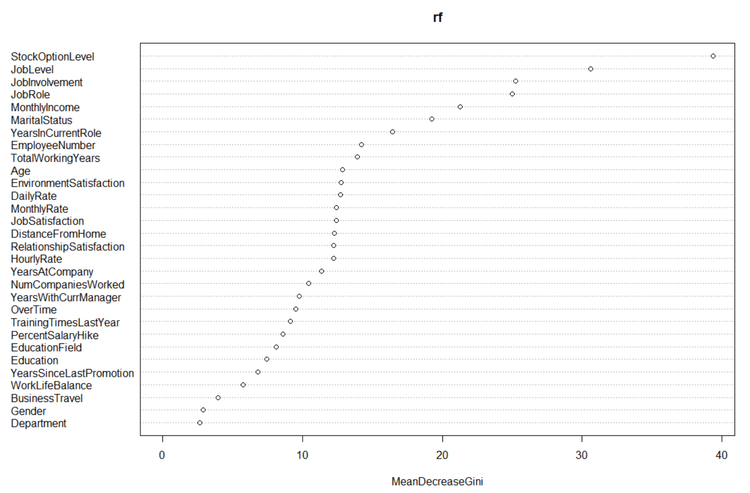
Conclusion
Individual feature analysis related to attrition can be done without building a machine learning model. You can plot each feature against attrition and find their relationship. However, if there are 1,000 features, it is difficult to go through the whole feature set to analyze each one. A machine learning model can give us enhanced understanding of data. At ProCogia our data scientists help our clients enhance their data understanding by deploying state of the art machine learning models.


