Most of the data we encounter in the real world is unstructured. A perfect example of unstructured data, text contains a vast amount of information that isn’t structured in a way a computer can easily process. Translating unstructured data into something that a computer can act upon is a major focus of artificial intelligence. The field of natural language processing (NLP) has grown tremendously in the past several years, and products such as smart assistants have developed out of this work. With our clients at ProCogia, we find that an important application of data science is to bring structure to large unstructured datasets like tweets, customer reviews, or survey responses.
Let’s look at some real-world textual data and see how applying machine learning can lead to potentially valuable insights.
For this short analysis we’ll look at tweets. FiveThirtyEight, the online news organization best known for political polling analysis, published a dataset of tweets linked to Russian trolls. We’ll explore this dataset and use K-means, a relatively simple machine learning algorithm, to extract topics from similar tweets. Finally, we’ll look at when some of these topics were popular in relation to news stories during the 2016 election.
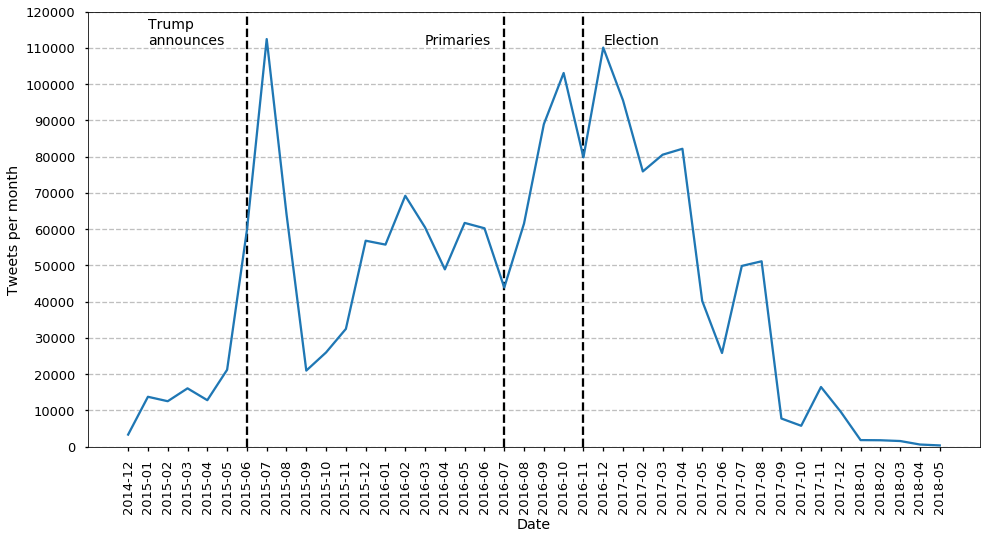
The published data is available in 13 csv files and amounts to nearly three million tweets. For each tweet we know the author’s Twitter handle, tweet content, published date, language, and region. To help focus our attention, let’s examine only English language tweets in the United States. Applying these filters to the dataset results in just under two million tweets. To get started, let’s plot the number of tweets per month from December 2015 to May 2018.

Right away, we can see clear patterns between tweet activity and major developments in the presidential campaigns.
Next, let’s clean up the text of the tweets a bit. I remove all punctuation, make all words lowercase, and remove stop words (common words like “the”), and non-words like internet links and emojis. Here’s an example of the tweet cleaning process:
“Veteran strategist Paul Manafort becomes Trump’s campaign chairman https://t.co/8c9twG9smG”
Cleaned up, this tweet is:
“veteran strategist paul manafort becomes trumps campaign chairman”
Although the cleaning process goes a long way toward rendering the text understandable to a computer, at the end of the day the computer must deal with numbers, not words. The process of converting words to numbers is called “vectorizing” and there are many techniques available to accomplish this task. I use a Python library called Gensim to train a shallow neural network according to the word2vec algorithm developed by researchers at Google to vectorize the tweet words.
The nice thing about word2vec is that similar words, or words that are used in sentences in similar ways, are close to each other in vector space. For example, if we ask the word2vec model about the most similar words to “america,” we get “country,” “usa,” and “nation,” among others. Conveniently, the word2vec model has already grouped similar word topics for us, but we desire to group whole tweets. To accomplish this, we need to translate the collection of words in an individual tweet into a single vector representation. I have chosen to simply take the average of each word vector in the tweet.
With each tweet now represented by an average word vector, we can use any unsupervised clustering technique to group similar tweets. For simplicity, I have used K-means, an algorithm that iteratively updates a predetermined number of cluster centers based on the Euclidean distance between the centers and the data points nearest them. In the end, any single tweet will fall into one of k clusters, where k is the user-defined number of expected clusters. Best practices exist for determining the optimal value of k, but in this case I have simply chosen a large number—50. I have inspected the clusters manually to combine similar clusters and identify the most distinguished clusters.
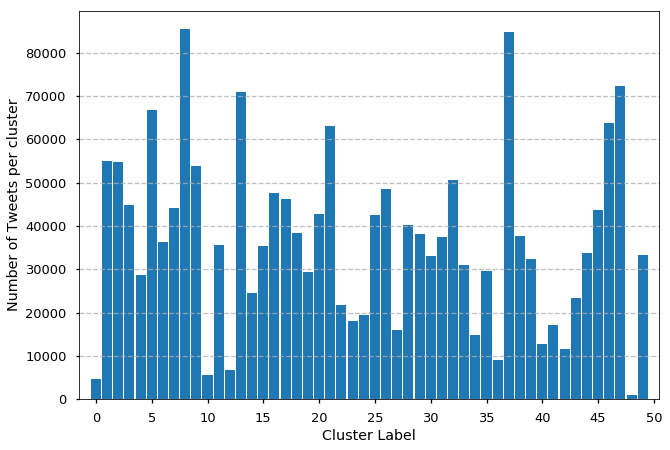
Here is the breakdown of cluster size (it’s worth noting that the cluster label number is completely random—there is no larger meaning behind any pattern that may arise in such a distribution):

We see that some clusters have many more tweets than others. This could mean one of two things—first, that there simply were many tweets posted with a similar topic, or that those clusters are defined by vague words and are not unique. The latter seems to be true of cluster 8, while the former is true of cluster 37 where a couple of popular, generic quotes were highly shared. By inspecting a few randomly chosen tweets in each cluster, I found the following interesting groups:
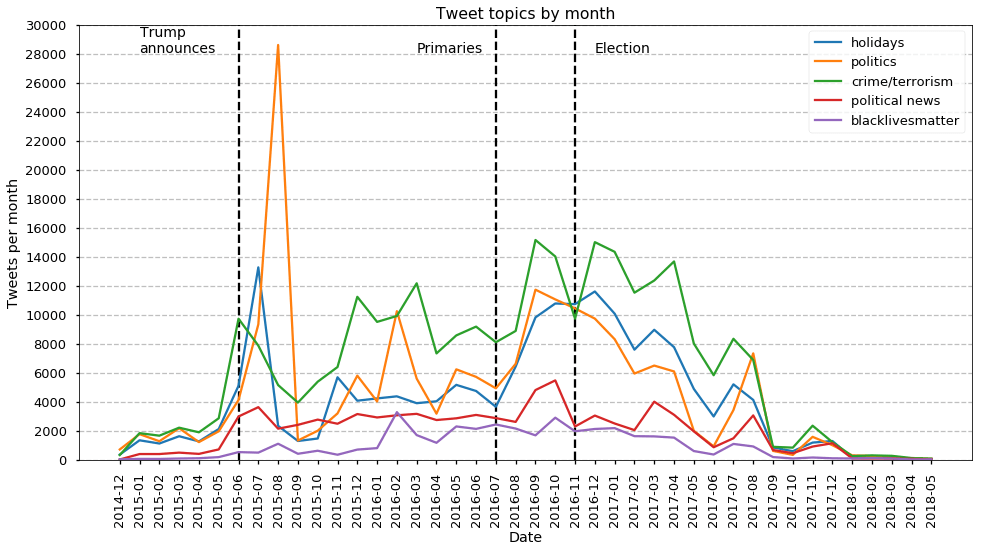
- Clusters 0, 5, 21, 36, and 39 were all related to holiday celebrations. This isn’t so interesting by itself, but we see an expected increase in these tweets around Thanksgiving, Christmas, and New Year’s Day.
- Clusters 1, 10, 12, 29, 41, 42, and 46 are related to politics in one way or another. These tweets show a sharp increase in frequency following candidate announcements along with an increase leading up to election day.
- Clusters 4, 15, 19, 25, and 33 were related to crime and or terrorism. Overall, these were the most frequent tweets to be posted, with a slight uptick as the election grew nearer.
- Clusters 32 and 39 were tweets that contained political news stories. These stories remained constant throughout the campaigns.
- Finally, clusters 12 and 30 are two unique cases. These tweets were related to the Black Lives Matter movement. They started off as infrequent tweets but became more frequent as the campaigns heated up.
 Using machine learning techniques, we were able to extract a few insights from a large dataset of tweets associated with Russian trolls during the 2016 Presidential campaign. When working with clients, I often find that dealing with unstructured data is a pain point for them. But with the techniques showcased in this blog, we can extract actionable insights from social media messages, online reviews, survey responses, and even advertisements. Unstructured data sources become less intimidating and more valuable to analyze. Our clients can turn these insights into action through targeted marketing campaigns or new product features and gain an advantage in their respective markets.


